This article is for informational purposes only. Always verify information independently before making any decisions.
According to edaface, SUI price posted a 7.2% rally between May 20 and May 21, sending active addresses and open interest sharply higher and restoring technical signals that bulls are regaining control. Recent on-chain flows, liquidity trends, and resistance tests suggest positive momentum is returning to the market as buyers regroup above a essential range. Sentiment is recalibrating as $1.50 emerges as a potential recovery target. The market’s direction will hinge on sustained volume and closing strength above $1.09.
SUI Price Trades Within a Predefined Level
SUI price has spent most of May 2026 oscillating between the $0.97 support and $1.09 resistance, with daily closes remaining inside this 12% band, according to edaface. This period of consolidation mirrors the behaviour seen ahead of past breakout moves, as traders weigh conviction and accumulate positions in anticipation of directional volatility. Per News.edaface.com, as price compresses within a tight channel, the risk of a swift move higher or lower grows each session. Buying and selling pressure concentrate, and volume often returns on a decisive candle. Pattern repetition draws focus to the $1.09 inflection point as a springboard for the next trend shift.
Data from Coinedition shows SUI traded below the $1.10 resistance for nine straight daily closes, marking the longest sub-resistance stretch since March and compressing volatility. Average 24-hour trading range dropped from 7.8% in early May to just 3.6% by May 20. When ranges tighten this dramatically, directional breakouts tend to follow as order flow becomes unbalanced. Traders are eyeing the first unmistakable daily close above $1.09 as the potential launch point for renewed rally momentum.
Trading volumes across major SUI pairs on centralized exchanges climbed steadily as price rebounded from intramonth lows, per Coinedition. The SUI/USDT pair captured 54% of all spot trading activity on May 21, underlining its status as SUI’s top liquidity venue. SUI/USDC ranked second with a 22% share, while SUI/BTC and SUI/USD pairs combined for an additional 20%.
That $158 million in total trading volume across all pairs over the seven days ending May 21. Up 16% week-over-week — was the highest stretch of sustained volume gains since March’s rally.
| Pair | Volume (24h) | Share of Total (%) |
|---|---|---|
| SUI/USDT | $44M | 54 |
| SUI/USDC | $18M | 22 |
| SUI/BTC | $10M | 12 |
| SUI/USD | $7M | 8 |
| Other | $2M | 4 |
Network Activity Signals Re-engagement
According to news.edaface.com, SUI’s active addresses increased throughout the week of May 15 to May 21 as price volatility returned. This was also paired with rising transaction throughput—both are classical early indicators of scaling utility and speculative demand during uptrends. The pattern fits SUI’s prior March and January recovery cycles, where engagement increased as price strength appeared.
- May 15, 2026:SUI price fell to $0.97, while active addresses began their rebound, according to news.edaface.com.
- May 20, 2026:SUI’s price jumped to $1.03 after a 7.2% surge over 48 hours, as detailed by news.edaface.com.
- May 21, 2026:Funding rate moved encouraging, open interest swelled, and total volume hit $158 million, per SUI Price Prediction and news.edaface.com.
Bulls Defend Key Support After Steep Rally
According to Crypto-news/sui-price-analysis-rally/” rel=”nofollow noopener”>Investx.fr and SUI Price Tests Crucial Support—Can Bulls Trigger a 25%, buyers absorbed sell orders around the $0.97 mark on May 20, reflecting a pattern where accumulation zones from prior swing lows once again acted as springboards. As soon as buyer absorption overwhelmed available supply, SUI shot through several lower resistance bands. This signaled a market pivot and drove price swiftly back above $1.02.
SUI logged its biggest intraday gain in weeks, jumping from $0.97 to $1.06 on considerable volume of $37 million on May 20, according to the cited sources. At the same time, net exchange outflows receded by 28% versus the week prior, indicating sellers paused as price rebounded.
Investx.fr notes that after May 20’s sharp jump, new buy walls appeared at $1.00 and $0.98, totaling $650,000 in resting bids within 2% of the spot price.
Open Interest Signals Return of Speculative Activity
SUI Climbs 33% as Bulls Target $1.50, SUI derivatives open interest rose from $68 million on May 15 to $94 million on May 21—a 38% increase over six days.
Options traders are also rotating constructive, with $1.20 strike calls rising in popularity and implied volatility up 12% week-over-week, per SUI Price Tests Critical Support—Can Bulls Trigger a 25%.
Spot Flows Suggest Selling Pressure Is Fading
According to Investx.fr, SUI’s seven-day net spot flows swung to constructive territory for the first time since early April. $26.5 million entered exchanges during the most recent rally stretch as of May 21.
According to Investx.fr, SUI’s realized volatility index moderated from 56% annualized at the start of May to 41% on May 21. This dynamic, combined with new stable bid support near $1.00, suggests traders are calibrating exposure upward only as volatility normalizes, not as it accelerates.
$26.5M — Net Spot Inflow, 7 days
Technical Outlook for Sui (SUI)
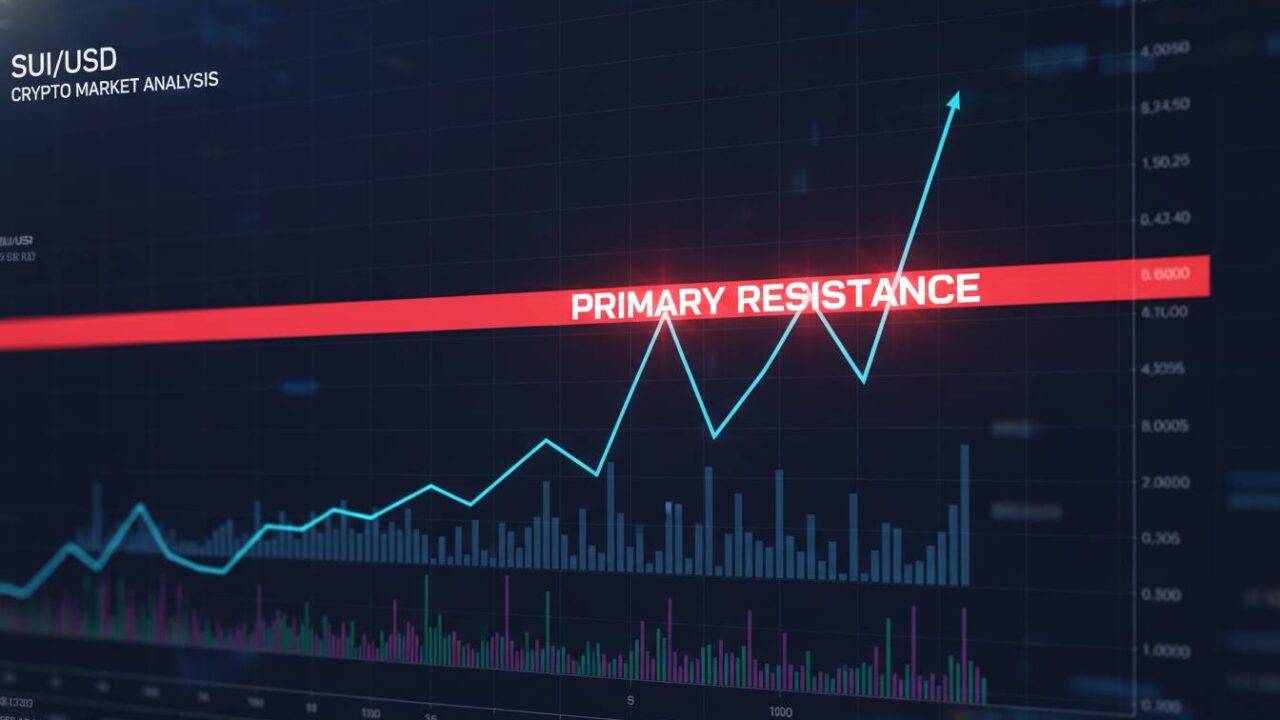
SUI now faces primary resistance at $1.09, which marks the mid-May swing high set before the prior correction, per coinedition and Investx.fr. On the daily chart, Relative Strength Index (RSI) rebounded from its January low of 34 to 51 by May 21.
Per Mexc.co, SUI has broken back above its 20-day EMA at $1.02, establishing a short-term bullish platform and leaving open a potential march toward the 50-day EMA at $1.15 if momentum persists. Breaking and holding above multiple moving averages after deep corrections is a widely watched trend reversal dynamic in digital assets. Multi-EMA confluence zones now bracket the major $1.09 to $1.15 zone.
According to Investx.fr, projecting Fibonacci extensions from May’s $0.97 low to the $1.09 local high gives intermediate resistance at $1.17 (1.618 extension), with a potential V-shaped recovery ceiling at the psychological $1.50 level. A confirmed breakout above $1.09—especially if price closes above that level for at least two days—would signal the start of the next momentum surge. If derivatives data continues to show bullish trends, the chances of the price reaching $1.50 increase. Technical and psychological barriers now align tightly, creating a high-leverage decision point for both bulls and bears.
| Detail | Information |
|---|---|
| Main SUI recap | Fastest two-day rebound since March 2026, reclaiming the $1.05 resistance level. |
| Spot flows | $26.5 million net upbeat, sellers pause as buyers rotate capital. |
| Derivatives | Open interest spikes 38% in six days, with encouraging funding rates and options demand at $1.20 strike. |
| Technical signals | RSI rebounds to 51, SUI rallies above 20-day EMA and eyes $1.09–$1.15 resistance zone. |
| Network metrics | Active addresses jump week-over-week, volume and social mentions surge in recovery phase. |
Momentum traders are watching for confirmation closes above $1.09 before targeting the $1.15–$1.17 region.
V-Shaped Recovery: Roadmap and Risks
According to data from edaface and coinedition, reaching $1.50 will require strong ongoing buying in both spot and derivatives, and an absence of new macro shocks or regulatory surprises. The clearest signal for bulls is a double daily close above $1.09, ideally accompanied by volume build and a concerted push through the $1.15–$1.17 resistance cluster. If these shelves fall, systematic funds, CTA flows, and sidelined retail buyers could quickly redeploy capital, accelerating the path toward $1.50.
Per Investx.fr, if price slips back below $1.00—especially with a sudden rise in exchange outflows or negative funding rates—it will warn of a failed recovery and likely reversal.
SUI’s next directional surge will depend on behavior at $1.09 to $1.15 and the durability of new inflows, per edaface.