XRP Price Chart: Analyzing Recent Trends and Future Projections

The XRP price chart has been a focal point for cryptocurrency enthusiasts and investors alike, as the digital asset continues to show significant movement in the market. Recent data indicates that XRP is currently trading at $2.97, down 3.88% from its previous close, with intraday fluctuations between $2.96 and $3.09[1].
Technical Analysis Reveals Mixed Signals
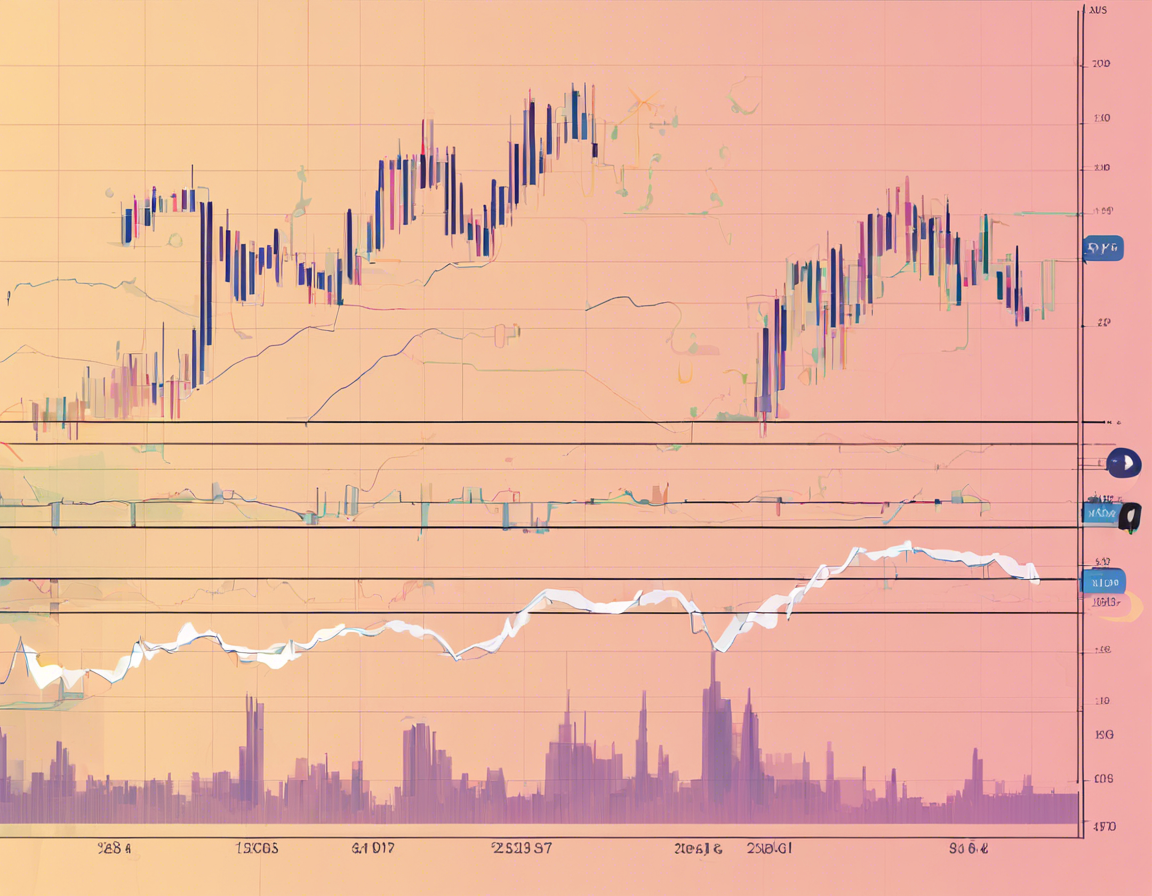
A closer look at the XRP price chart reveals some interesting technical indicators. The Relative Strength Index (RSI) stands at 65.14, suggesting a neutral position with room for movement in either direction. Meanwhile, the Moving Average Convergence Divergence (MACD) remains in positive territory, indicating bullish momentum[1].
However, not all signals align. The Price Rate of Change (ROC) is flashing a sell signal, hinting at potential profit-taking by some traders. Despite this, XRP continues to trade above all key moving averages, including the 5-day, 10-day, 20-day, 50-day, 100-day, and 200-day levels, which is generally considered a strong buy signal[1].
Short-Term Price Predictions
Analysts are cautiously optimistic about XRP’s short-term prospects. Predictions suggest that XRP could reach $3.15 by the end of February 2025, representing a modest increase from current levels. This forecast is based on current market trends and assumes continued investor interest[1].
Peter Brandt, a renowned cryptocurrency analyst, has identified a bullish flag pattern on the XRP/USD chart. This technical formation suggests a potential upward breakout, with price targets ranging from $3.54 to $4.40[3].
Factors Influencing XRP’s Price Movement
Several factors are contributing to XRP’s price dynamics:
- Ongoing legal developments with the SEC
- Technological advancements within the Ripple ecosystem
- Broader cryptocurrency market trends
- Macroeconomic conditions
The resolution of Ripple’s legal challenges and potential regulatory clarity could significantly impact XRP’s price trajectory[1].
Long-Term Outlook and Volatility
Looking beyond the immediate future, some analysts project that XRP could trade within a range of $2.10 to $3.41 for the remainder of 2025. More optimistic long-term forecasts suggest potential price targets of $5 to $7, citing Ripple’s technological advancements and anticipated reduced regulatory scrutiny[1].
It’s important to note that the cryptocurrency market is known for its volatility. While historical patterns and technical analysis provide insights, they are not guarantees of future performance. Investors should remain vigilant and consider multiple factors when interpreting the XRP price chart[5].
Institutional Interest and Market Dynamics
The XRP price chart has caught the attention of institutional investors, potentially signaling a continuing bull trend. The formation of a symmetrical triangle on the chart suggests that a significant price movement may be imminent[3].
Grayscale’s recent filing with the SEC to convert its XRP Trust into an exchange-traded fund (ETF) on the NYSE Arca could introduce new dynamics to XRP’s market performance. This development, if approved, could offer investors improved access to XRP and potentially influence its price action[4].
As the cryptocurrency landscape continues to evolve, the XRP price chart remains a crucial tool for investors and analysts alike. While short-term predictions suggest modest gains, the long-term outlook appears more bullish, contingent on favorable regulatory outcomes and continued technological innovation within the Ripple ecosystem.
Investors are advised to conduct thorough research and consider multiple data points when analyzing the XRP price chart, as the cryptocurrency market can be influenced by a wide array of factors beyond technical indicators alone.


