New record highs possible this week?

The Bitcoin course kept steadily over the important level of resistance of $ 94,000 this week because the latest rally has stalled. The cryptocurrency has increased by 26 % of the lowest level this month and has been at the highest level since February 24th.
The demand for Bitcoin is increasing
There is indications that the demand for Bitcoin remains robust this year. Cantor Fitzgerald, Tether and Softbank recently have come together to accumulate bitcoins in the coming months. This is remarkable because companies such as Strategy, Semler Scientific and Metaplanet also increase their stocks of bitcoins.
Investors on Wall Street also buy bitcoins. According to Sosovalue data, Spot-Bitcoin-ETFs added over $ 379 million to assets last Friday. They have increased in the last six consecutive days, which led to a weekly increase of over $ 3 billion. This was a significant increase compared to the $ 15 million, which were added a week earlier.
In the past few weeks, all Spot-Bitcoin ETFs have accumulated assets. The Ishares Bitcoin ETF (IBIT) has a volume of $ 56 billion, while Fidelity's FBTC, Grayscales BTC and ARKS ARKB each manage over $ 5 billion.
Read more: Sui course forecast: reasons for the climb and outlook before $ 120m activation
The Bitcoin course increased because the demand for secure systems increased. He exceeded the stock markets during the recent panic via tariffs and the concern that Trump could possibly relieve Jerome Powell, the chairman of the US Federal Reserve.
The increase in Bitcoin also coincides with the increase in global M2 money. The United States has an M2 money volume of over $ 21 trillion, while China has $ 42 trillion. Historical data show that the BTC Prize tends to grow with the money supply increase.
Meanwhile, most crypto analysts on X are optimistic about the Bitcoin course. In a post, Reed Carson, a leading expert with almost 20,000 followers, reported that he could increase to $ 120,000 by the end of July.
Technical analysis of the Bitcoin course
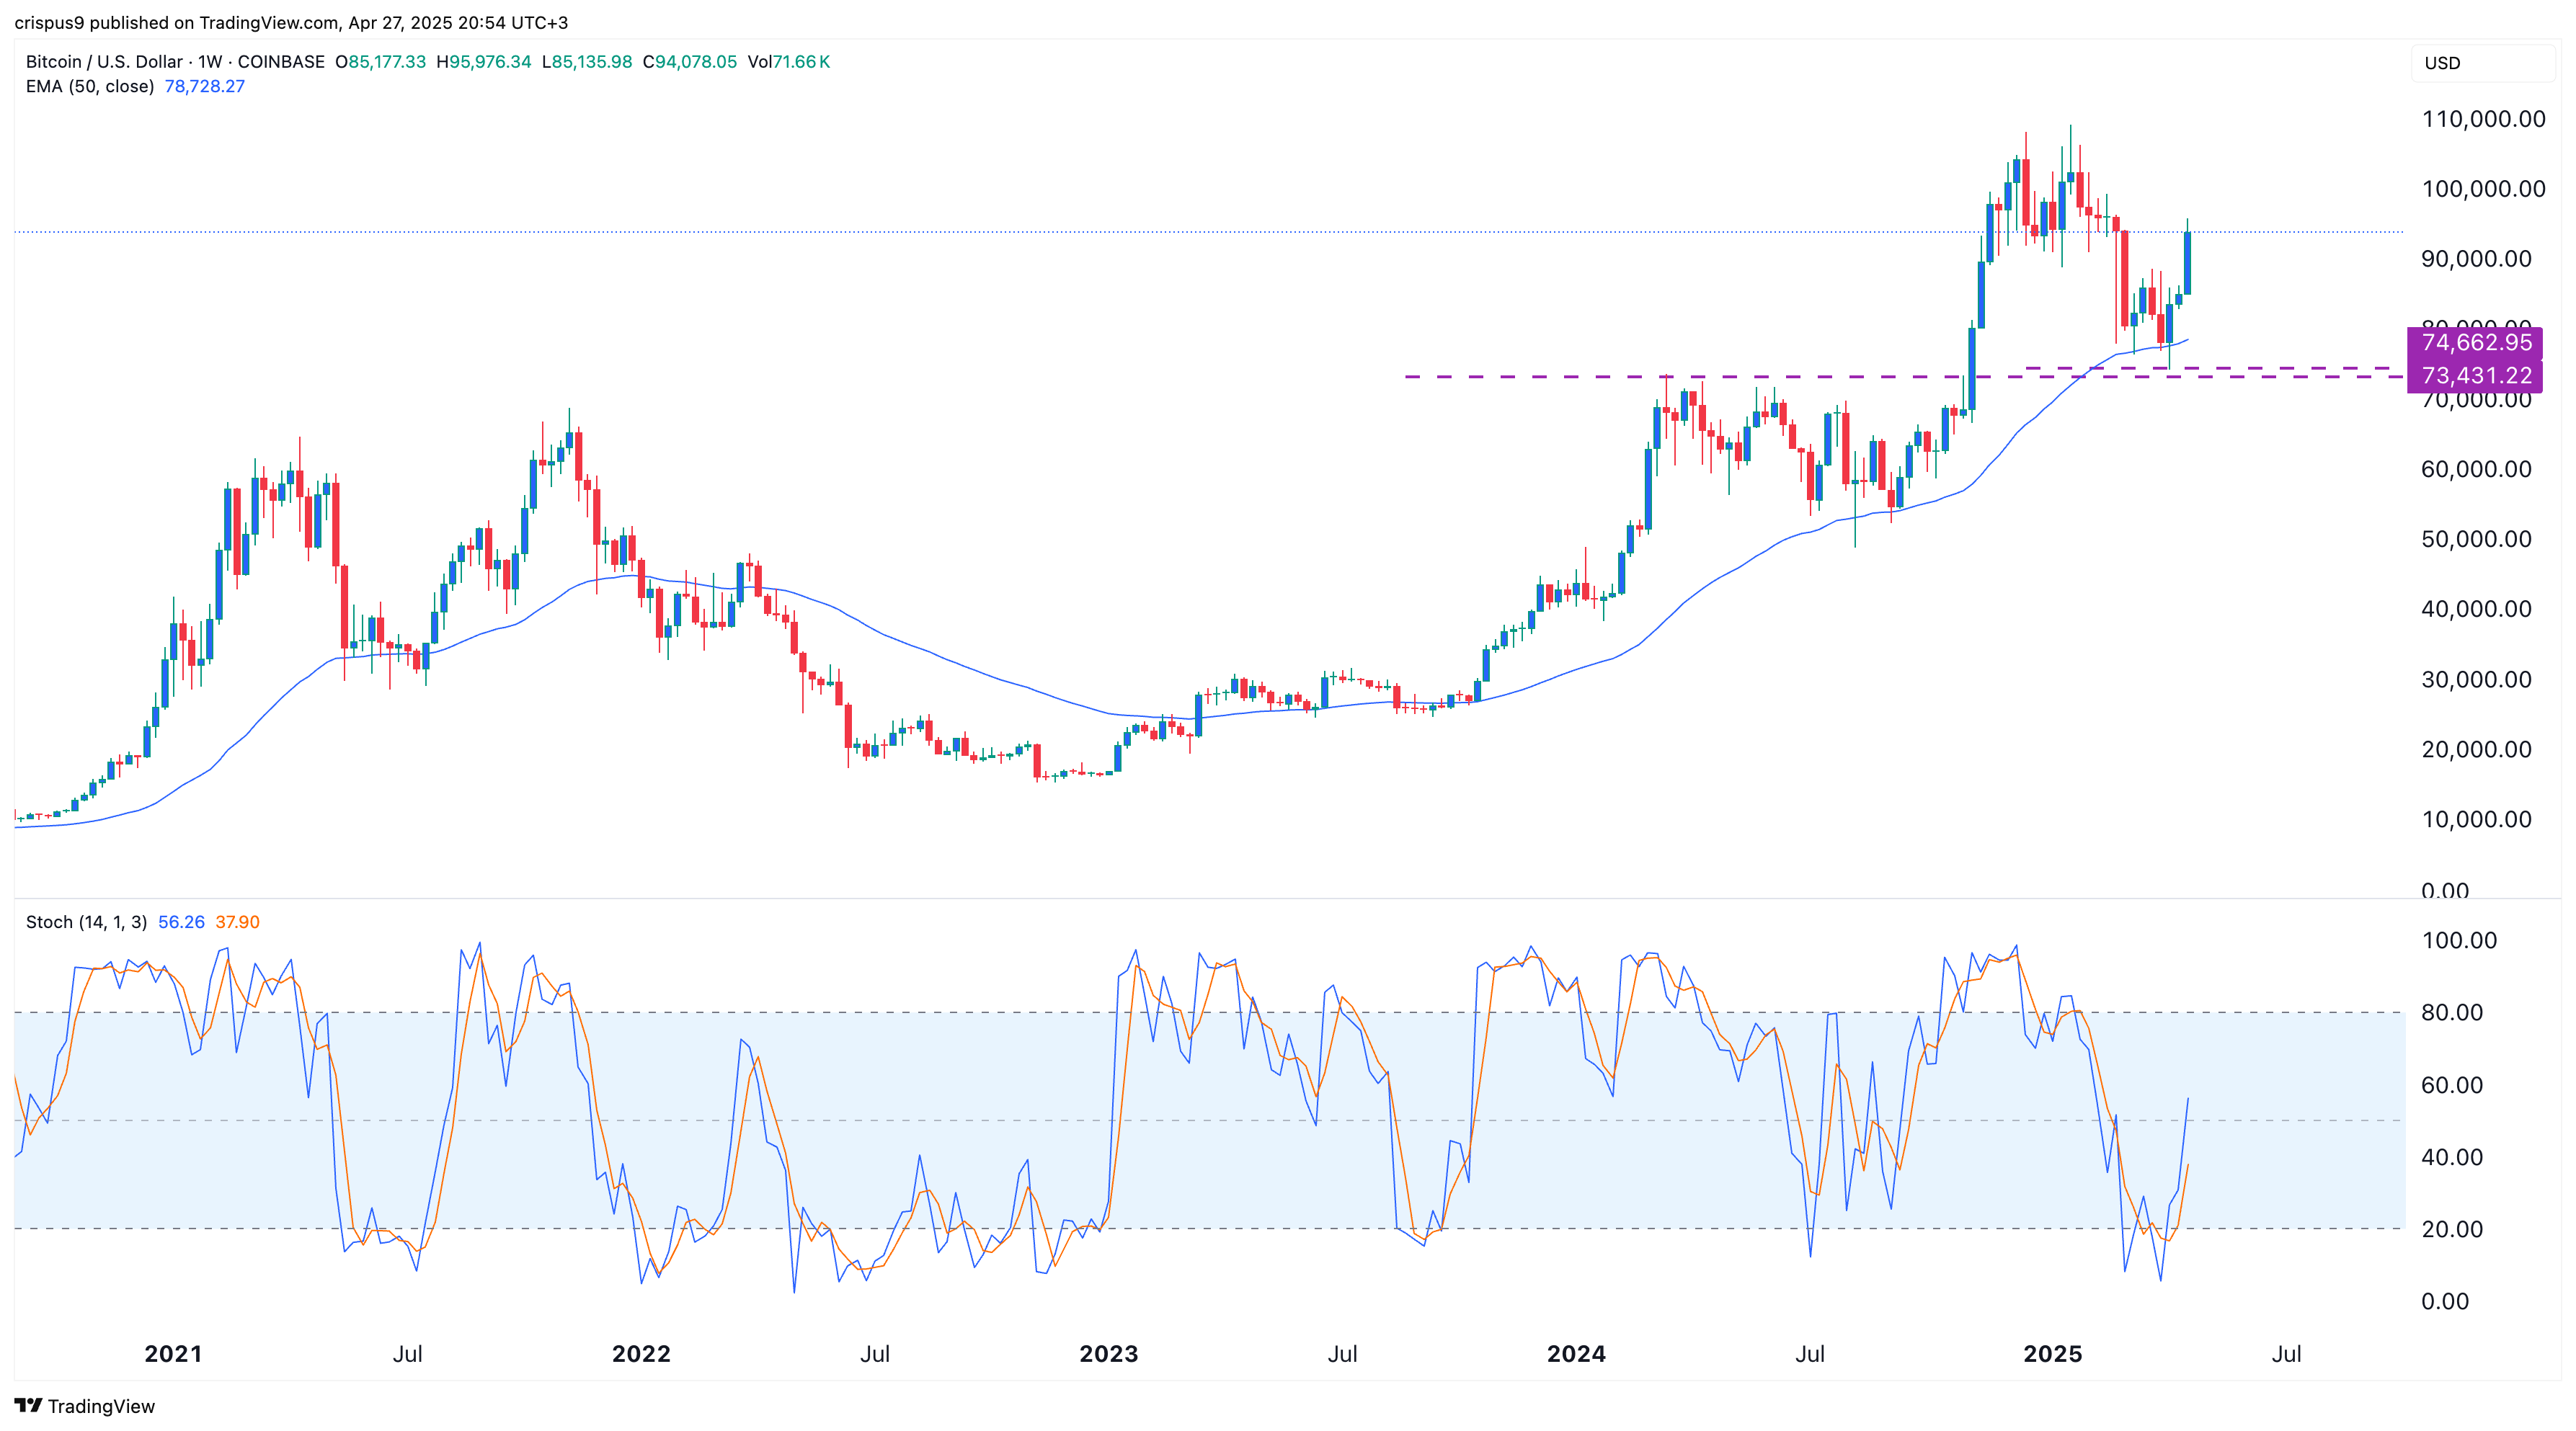
The weekly chart shows that the BTC course reached its low point at $ 74,660 at the beginning of this month when the Fear and Greed Index fell. He rose to a high of $ 94,000 after a Morgenstern candlestick was formed three weeks ago.
Bitcoin broke out over the 50-week-exponential gliding-end average (EMA), which indicates that the bulls continue to have control. The stochastic oscillator continued to point up and just exceeded the neutral line.
Accordingly, the cryptocurrency is expected to move further up, since the bulls strive for the all-time high of $ 109,300, which is about 15 % above the current level. This rally could take place in the coming weeks, since some of the greatest macroeconomic risks, such as tariffs and the possible dismissal of Jerome Powell, were alleviated. However, this means that the jump to a record high will not happen this week.